
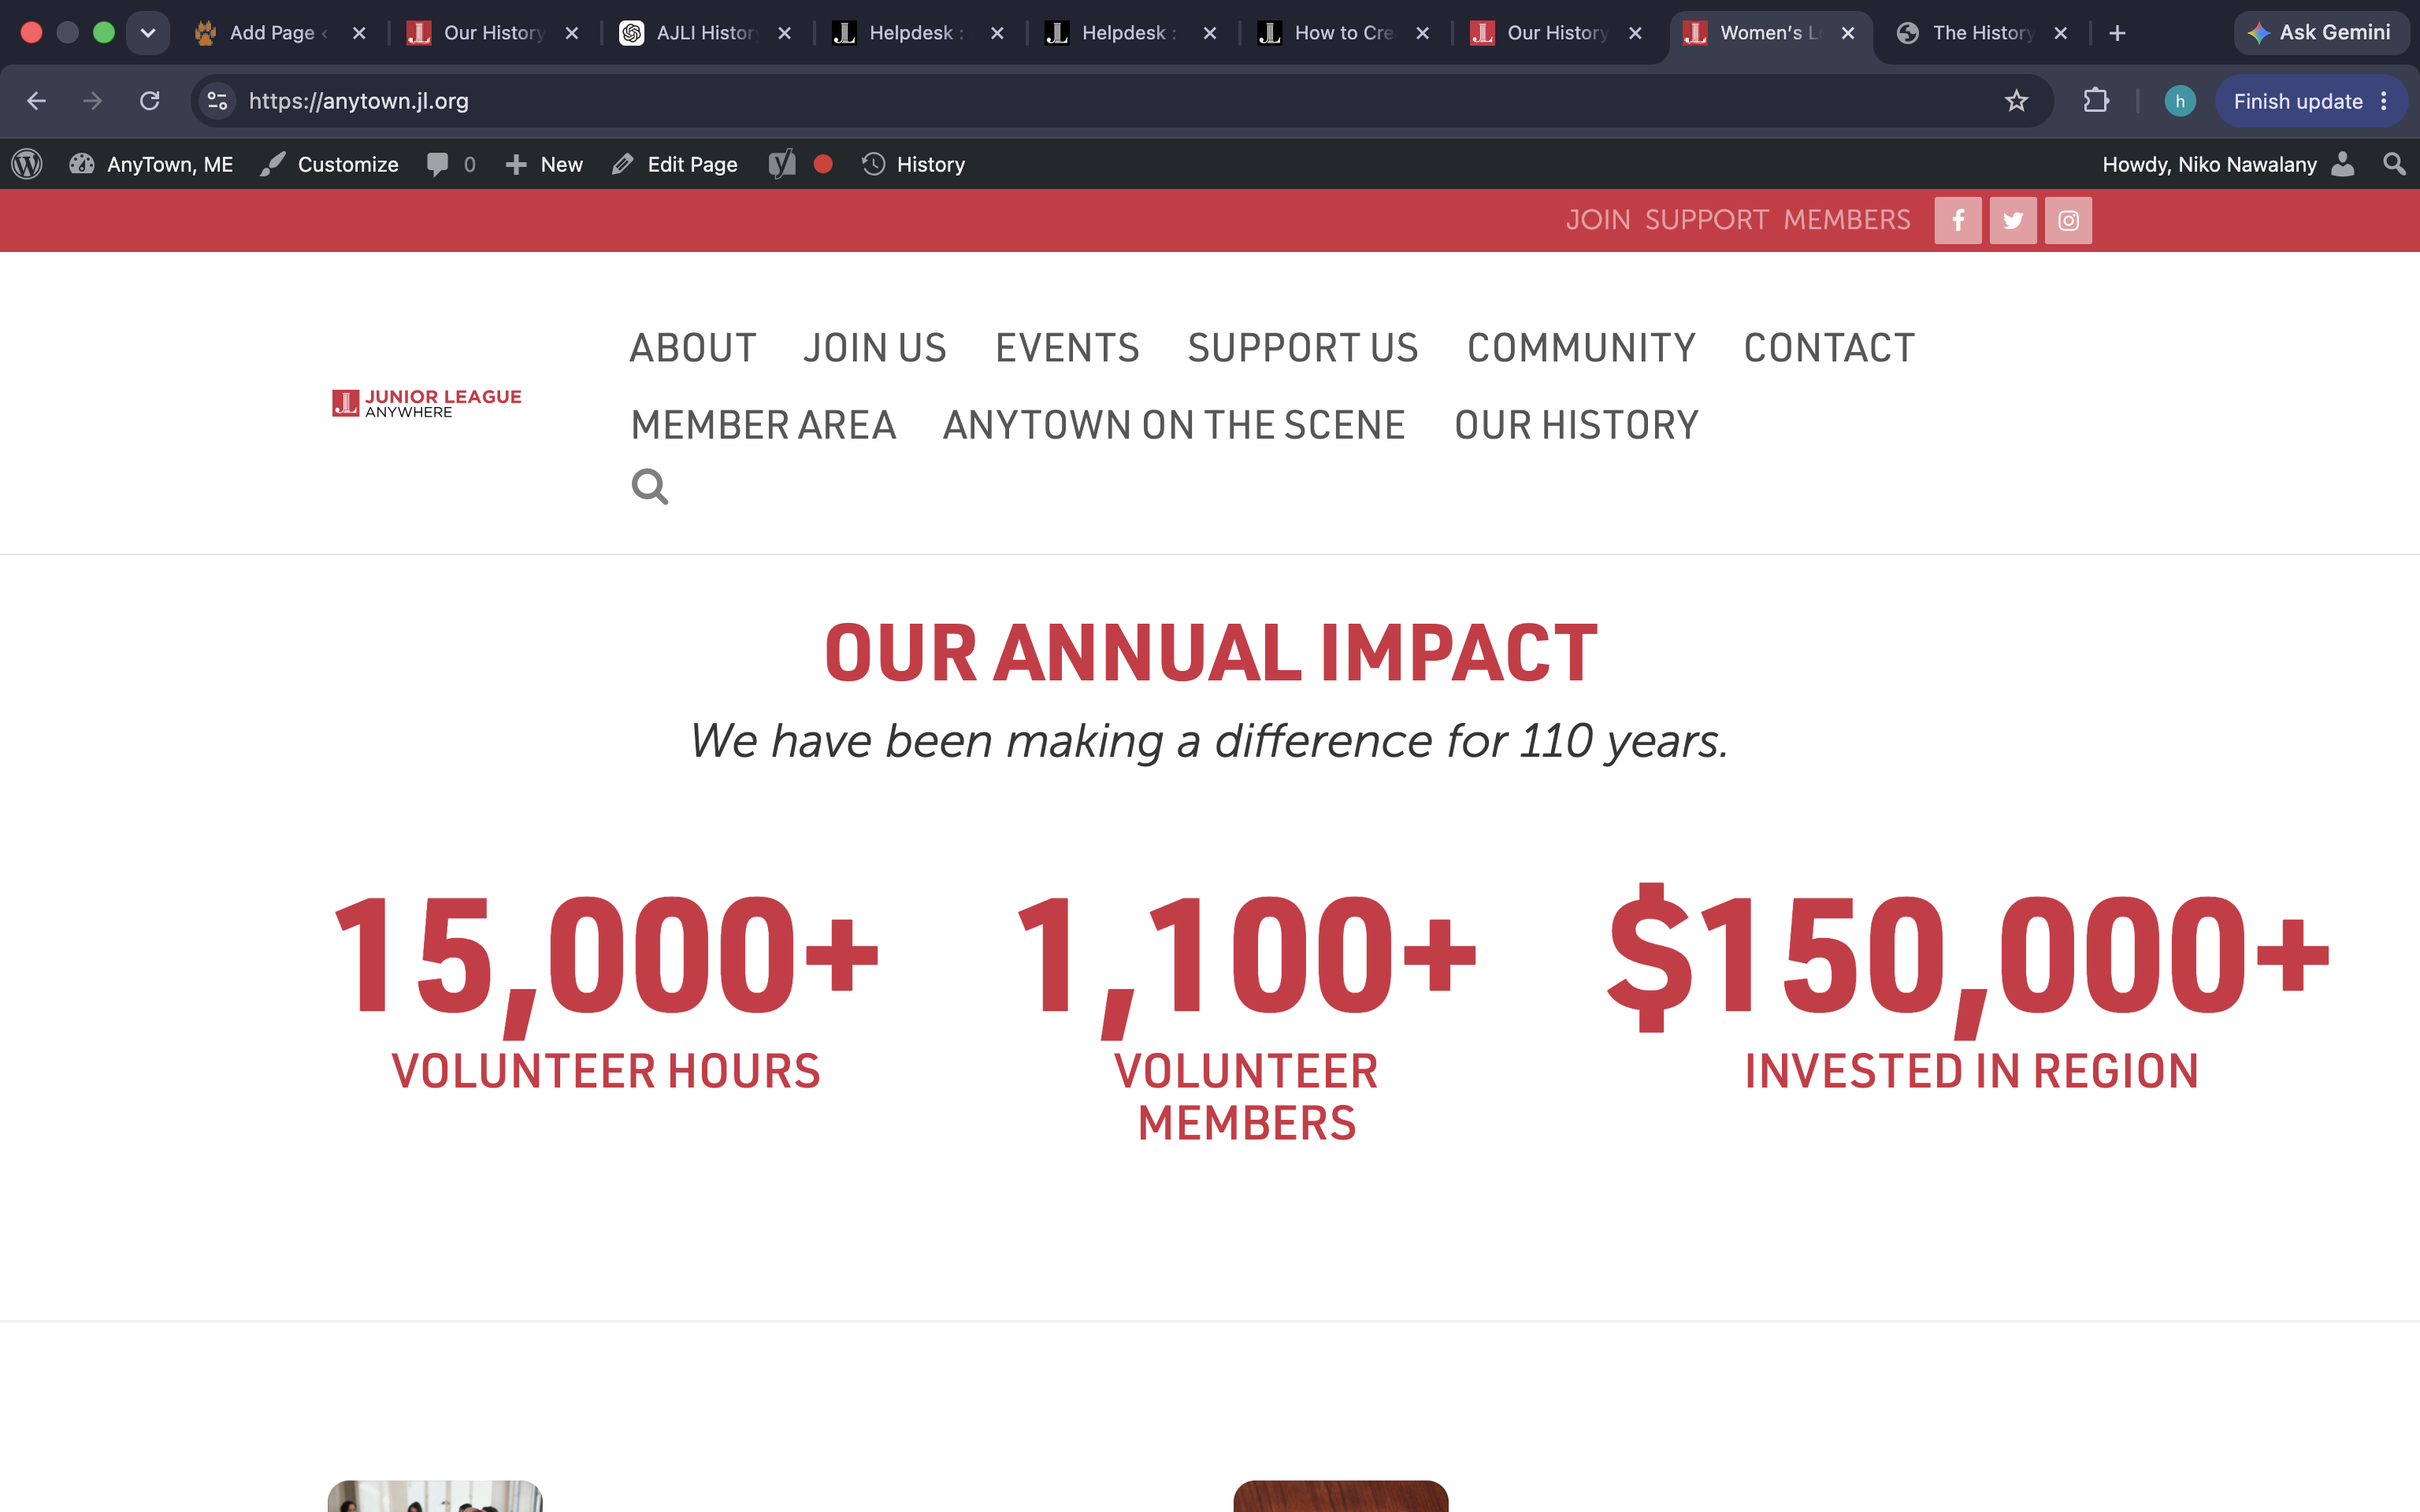
The Impact Statistic Section is designed to highlight the numbers behind your League's impact. This section displays key statistics in a visually engaging format, making it easy for visitors to quickly understand your organization's reach and accomplishments.
Examples of statistics you might feature include:
Volunteer hours served
Community members impacted
Dollars invested in the community
Number of active members
Number of community projects
Scholarships awarded
Years of service
Before You Begin
Gather the statistics you want to showcase, including:
The number or statistic itself
A short description or label
Optional introductory text to provide context
Tip: Choose metrics that are meaningful, current, and easy for visitors to understand at a glance.
Step 1: Create or Edit a Page
Log into your League's WordPress dashboard.
Navigate to Pages.
Open an existing page or click Add New Page.
Examples of pages that commonly use this section:
About Us
Community Impact
Our Story
Annual Report
Homepage
Step 2: Add an Impact Statistic Section
Scroll down to the Interior Page Sections area.
Click the blue + Add Section button.
Select Impact Statistic Section from the dropdown menu.
A new Impact Statistic Section accordion will appear.
Step 3: Add Optional Introductory Content
Expand Section Optional Introductory Content if you would like to add a heading or introductory message above your statistics.
Examples:
Heading: Our Impact by the Numbers
Text:
For more than 75 years, the Junior League of AnyTown has been committed to developing women leaders and improving our community through volunteer action, collaboration, and training.
This introductory content is optional and can be left blank.
Step 4: Add Your Statistics
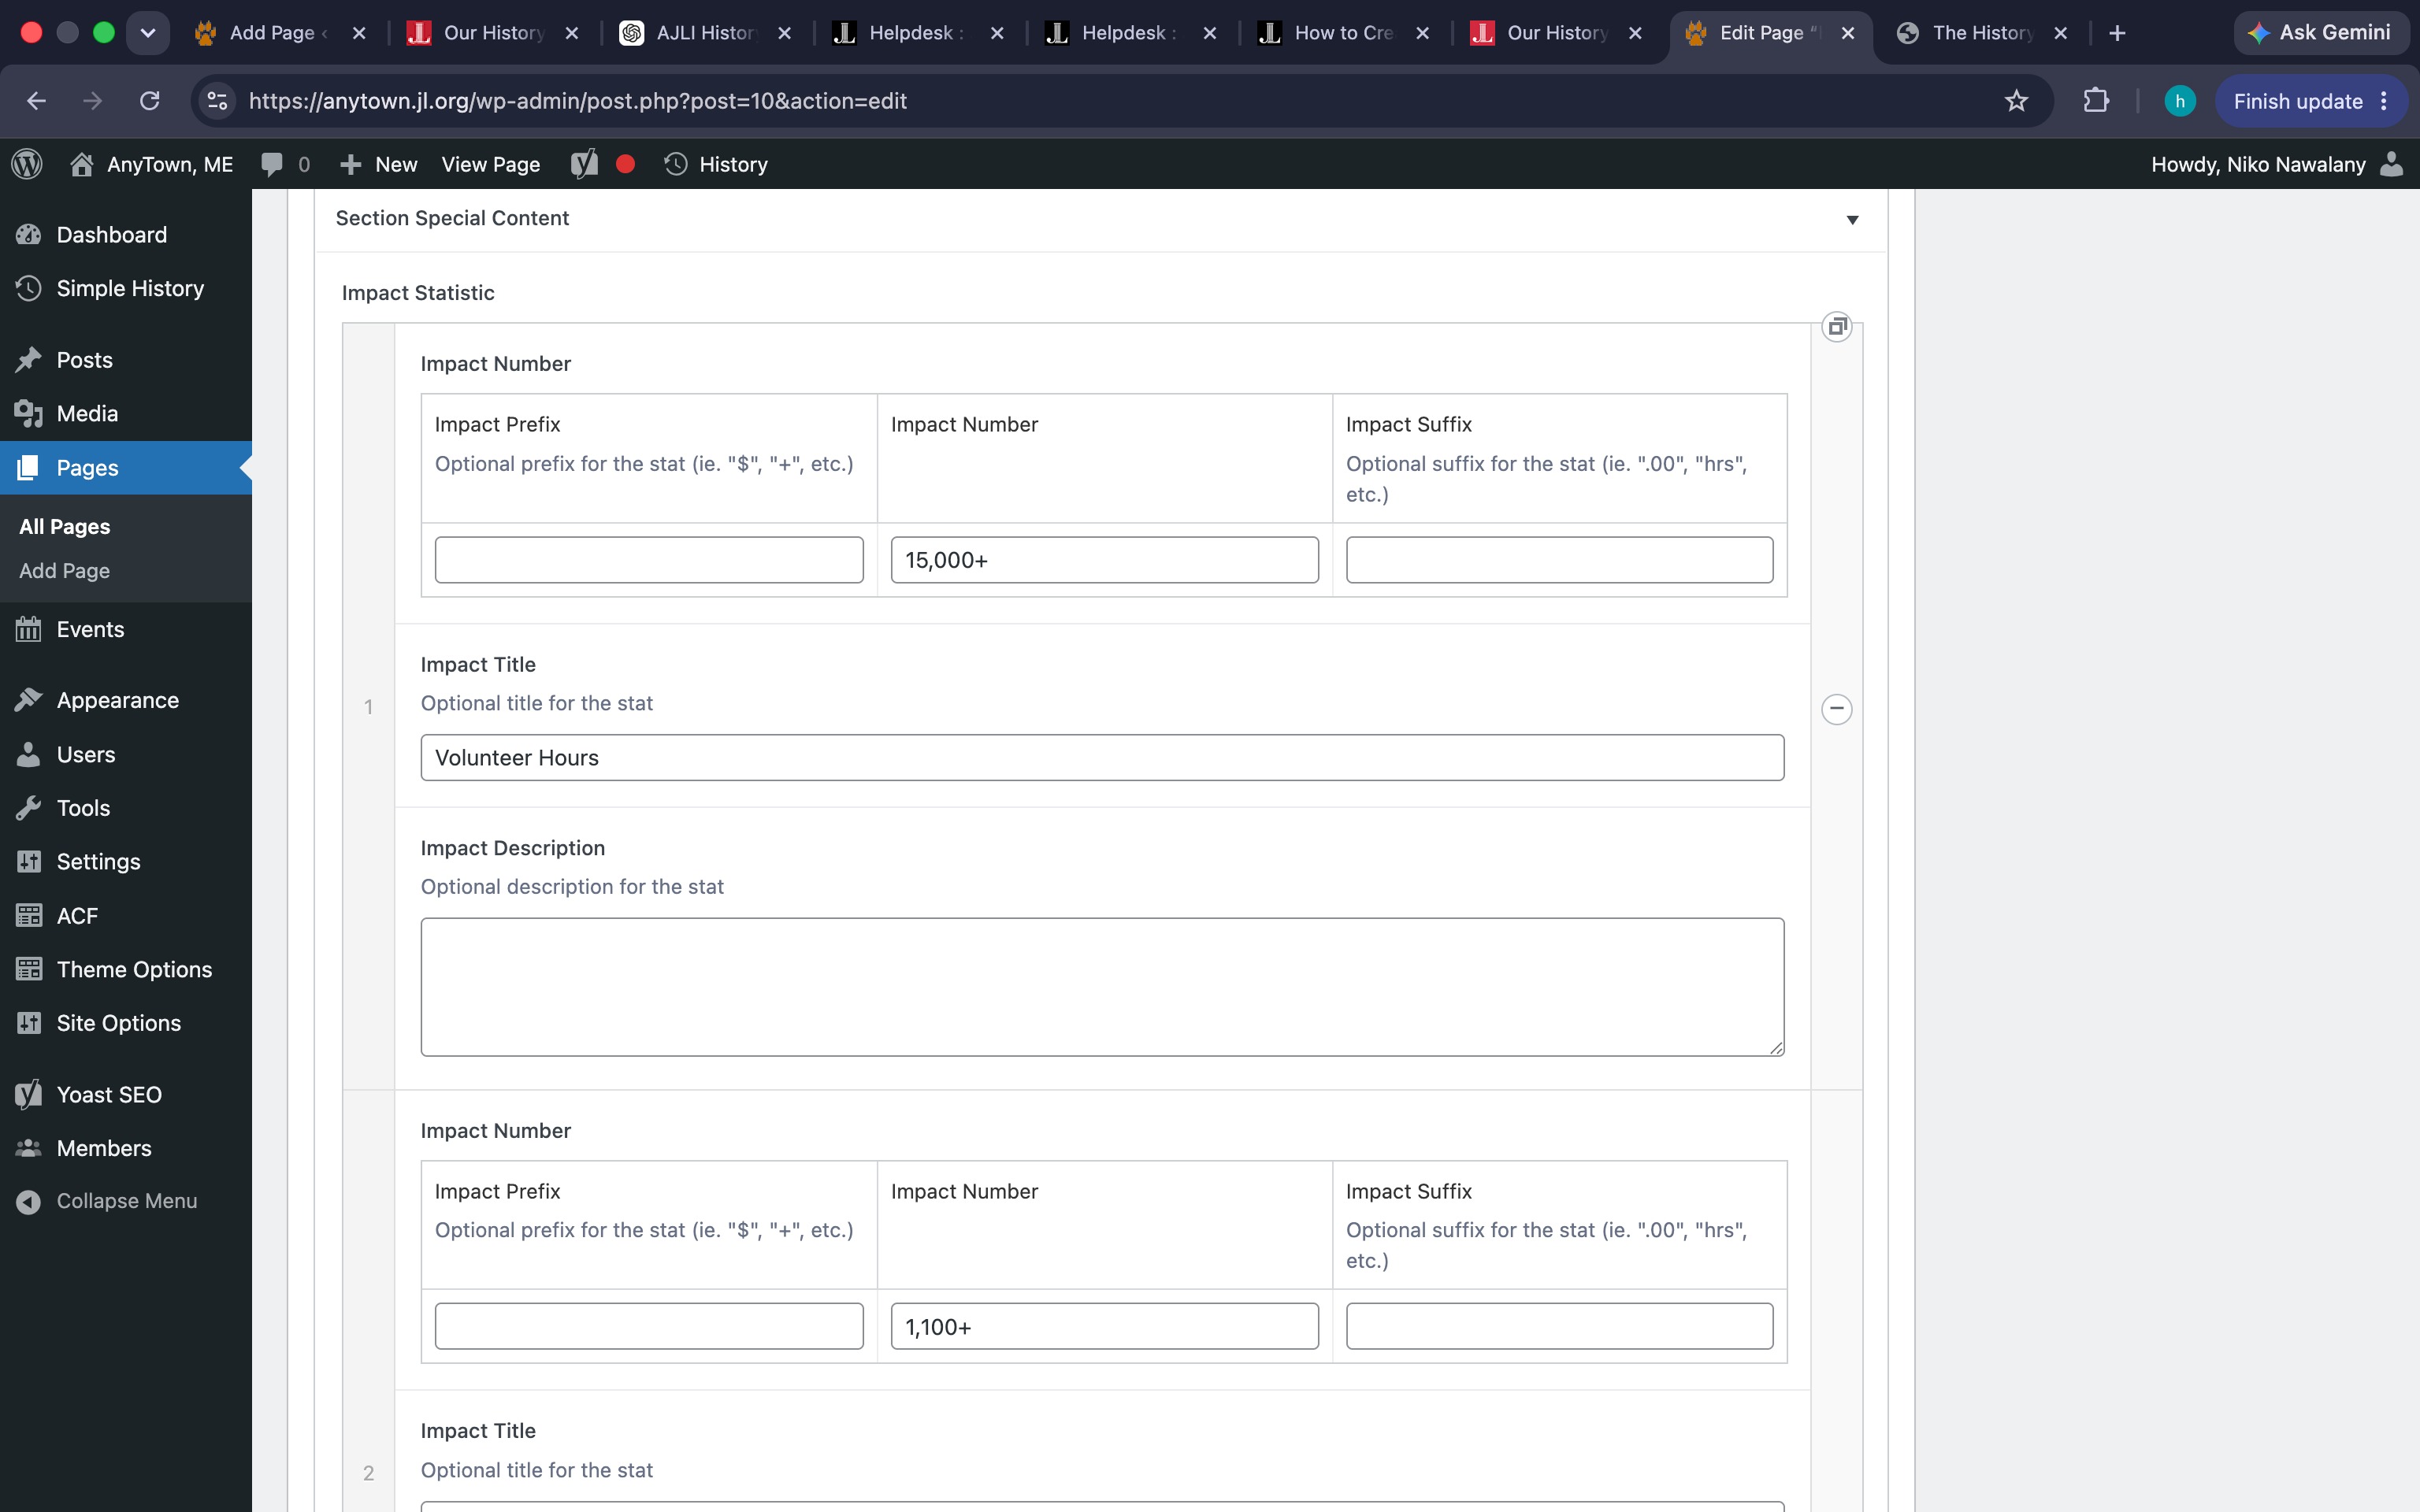
Within the section, you'll create individual statistic cards.
For each statistic, complete the following fields:
Statistic Number
Enter the numerical value you want to highlight.
Examples:
10,000+
95
$1.2M
7,500
75+
Statistic Label
Enter a short description that explains the number.
Examples:
Volunteer Hours Served Annually
Active Members
Community Partners
Children Reached
Dollars Invested in Local Programs
Optional Supporting Text
If available in your League's configuration, add a brief explanation or context.
Example:
Since 2020, League volunteers have contributed more than 10,000 service hours to community initiatives.
Step 5: Add Additional Statistics
Repeat the process until you've added all of your impact metrics.
A good practice is to feature three to six statistics to keep the page visually balanced and easy to read.
Example:
| Statistic | Label |
|---|---|
| 10,000+ | Volunteer Hours Served |
| 350 | Active Members |
| $1.2M | Invested in the Community |
| 45 | Community Partners |
Step 6: Preview Your Section
Before publishing:
Click Preview.
Verify that:
Statistics display correctly.
Numbers are easy to read.
Labels are concise.
The section looks balanced on desktop and mobile devices.
Step 7: Publish Your Page
When you're satisfied with the layout:
Click Publish or Update.
Visit the page on your public website to confirm everything displays as expected.
Best Practices for Impact Statistics
Keep It Simple
Choose statistics that can be understood in a few seconds.
Focus on Outcomes
Highlight the impact your League has made, not just activities completed.
Use Current Data
Update statistics regularly to keep your website fresh and accurate.
Be Consistent
Use the same formatting throughout the section.
Examples:
✔ 10,000+ Volunteer Hours
✔ $1.2M Invested
✔ 75 Years of Service
Avoid mixing formats unnecessarily.
Limit the Number of Statistics
Too many statistics can overwhelm visitors. Focus on the metrics that best tell your League's story.
Ideas for Statistics to Feature
Years of Service
Volunteer Hours
Active Members
Sustainer Members
Community Partnerships
Grants Awarded
Scholarships Funded
Children Served
Meals Provided
Books Distributed
Leadership Programs Conducted
Dollars Raised for Community Programs
Example Impact Statement
For more than 75 years, the Junior League of AnyTown has empowered women leaders and strengthened our community through volunteer service and meaningful partnerships. Our impact can be seen in the numbers—and in the lives changed through our work.
The Impact Statistic Section is a simple but powerful way to demonstrate your League's mission in action and help visitors quickly understand the difference your organization makes in the community.